Reviewer Metrics Report
The Reviewer Metrics Report displays reviewer productivity in Workflow batches.
Reviewers include:
-
All users assigned to the Review matter
-
All users who have checked out a batch in the Workflow
-
All users who have coded a document in a batch in the Worfkow.
-
All users currently assigned to a stage in the Workflow.
Note: This could be a different user than the one who checked the batch.
Examples
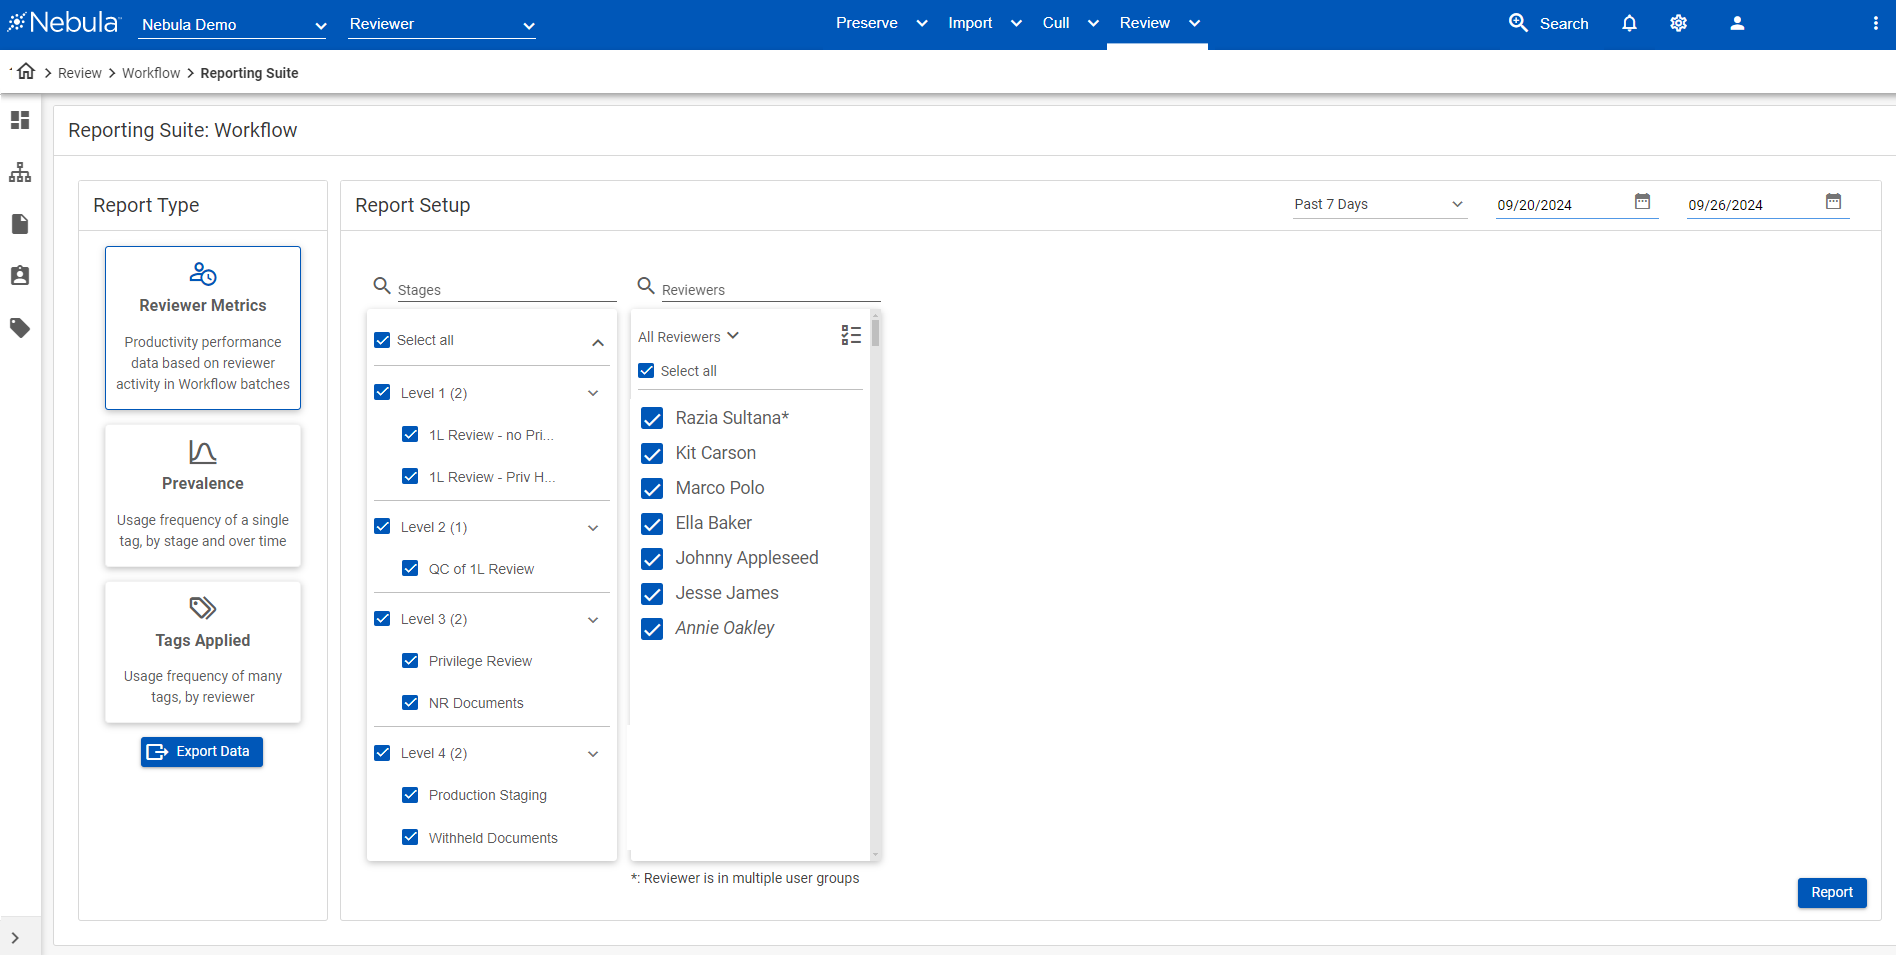
Reviewer Metrics settings
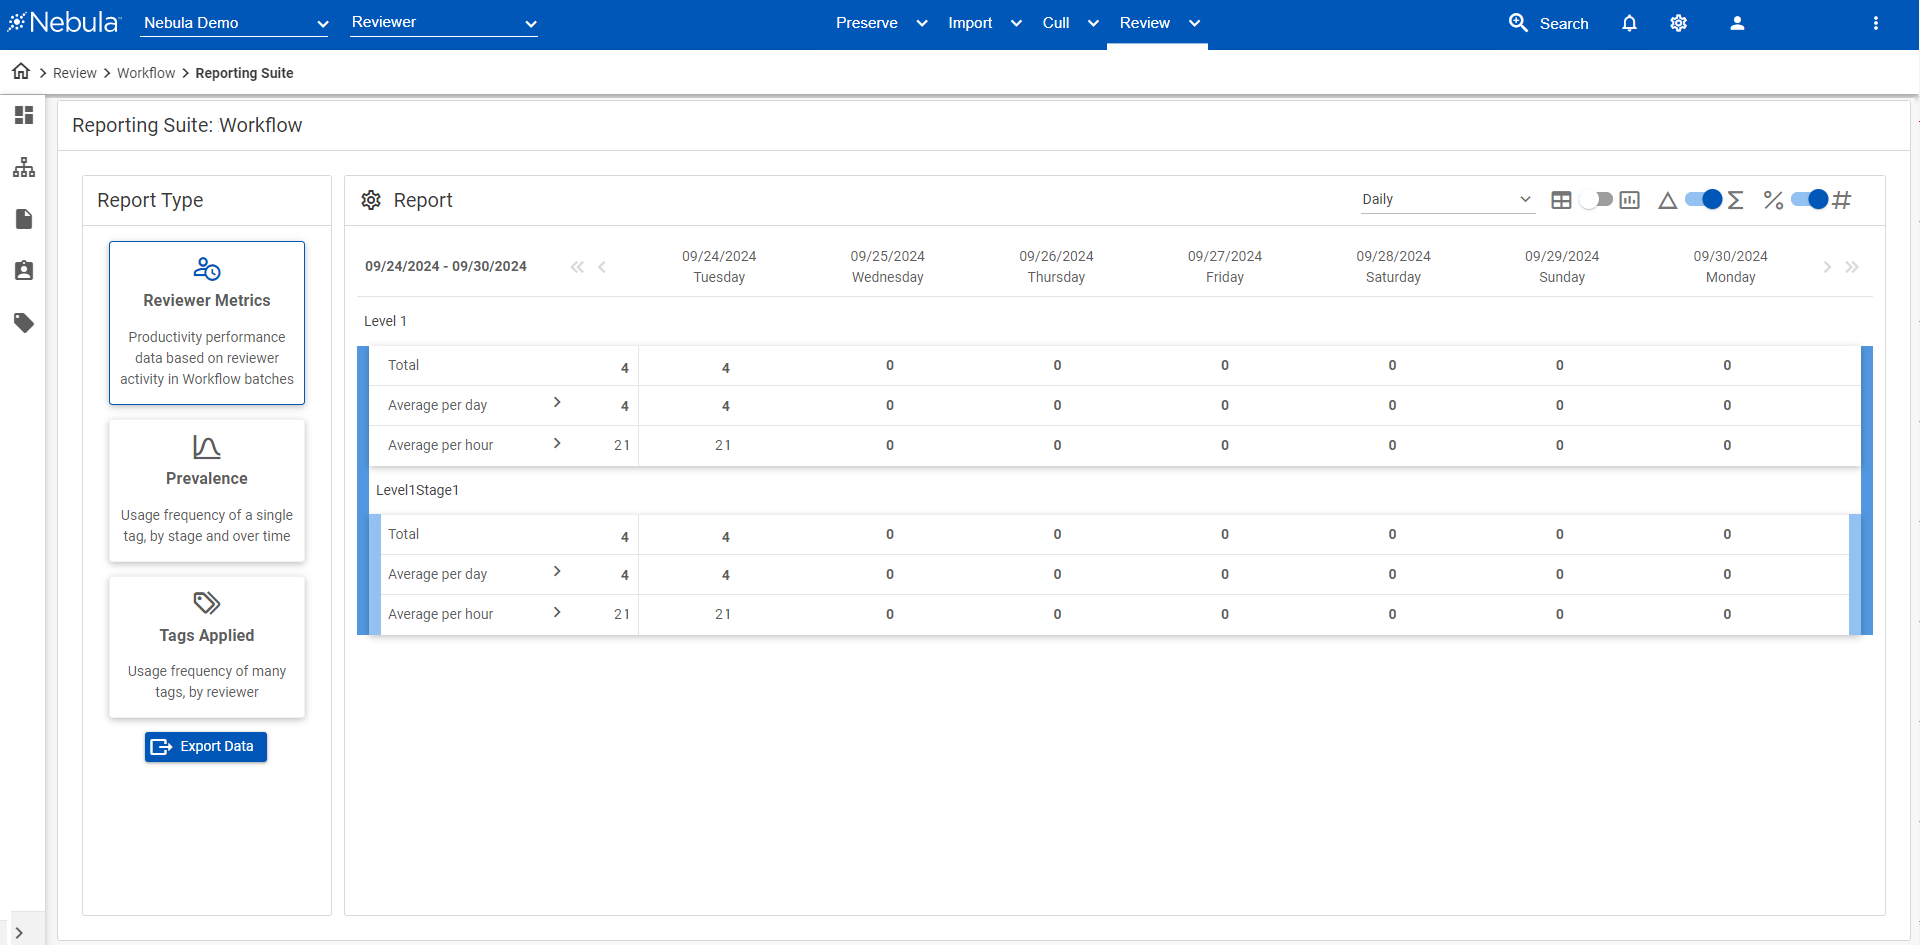
Reviewer Metrics report as table
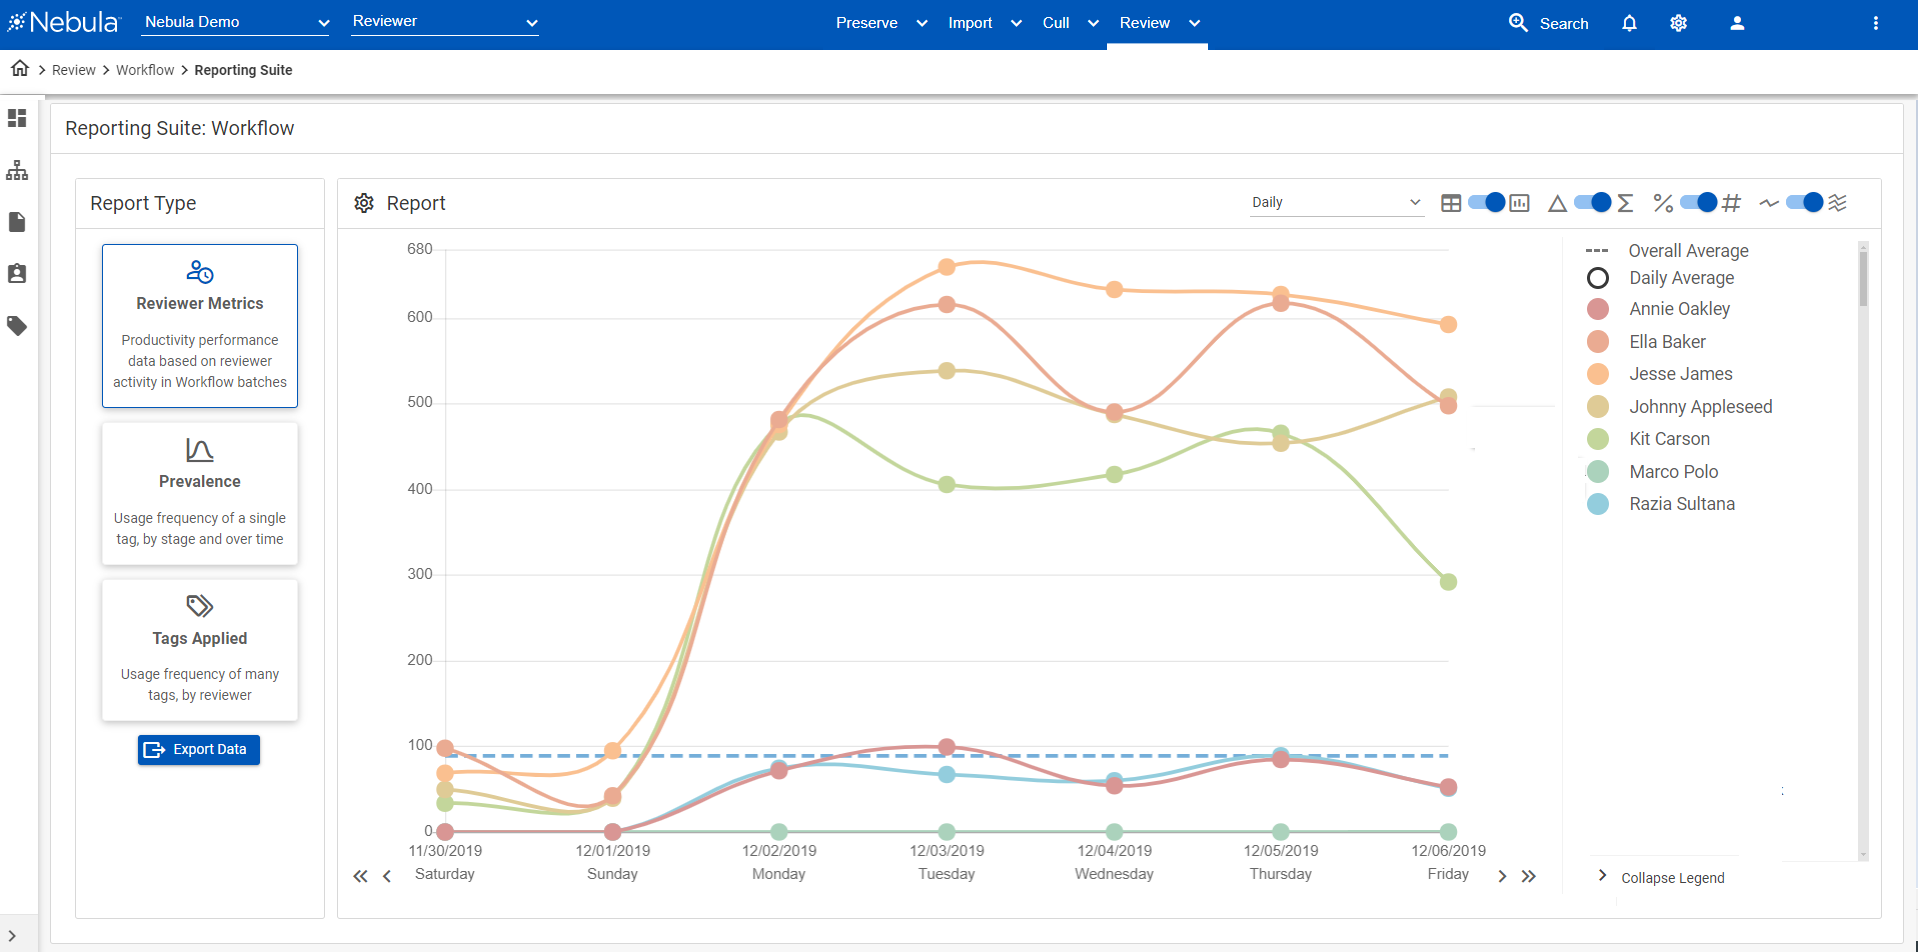
Reviewer Metrics report as graph
Reviewer Metrics Calculations
| Sum # | Sum % |
Delta # |
Delta % | |
|---|---|---|---|---|
| Chart total rows |
|
|
|
|
| Chart average rows | Calculated daily/hourly rates. | Percent of reviewers rate over calculated average. Calculated average for a day is 500 documents a day, reviewer X has 400 documents a day, percentage would be 400/500. |
Total average for a day is 500 documents a day, reviewer X has 400 documents a day, percentage would be -100. |
Total average for a day is 500 documents a day, reviewer X has 400 documents a day, percentage would be -100/500. |
| Graph values | The lines on the graph when Sum is selected is rendered from the data points noted above (Total data). | The lines on the graph when the Sum is selected is rendered from the data points noted above (Totals data). | The lines on the graphs when Delta is selected is rendered from the data points noted above (Daily rate). | The lines on the graphs when Delta is selected is rendered from the data points noted above (Daily rate). |
| Graph average | Average document count that day/week for selected group. | Average percentage contribution for that day/week for selected group. | N/A = X-axis |
N/A = X-axis |
Non-review Days are marked as “–“ in the tables.
If there were no reviews done that day (for a specific reviewer / stage) and this are not counted towards averages.
Example
In the following:
| Mon | Tue | Wed | Thu | Fri |
|---|---|---|---|---|
| 10 | - | 20 | - | 30 |
The average is 20.