Prevalence
Prevalence reports display singular tag application metrics by reviewer, by stage and over time.
Examples
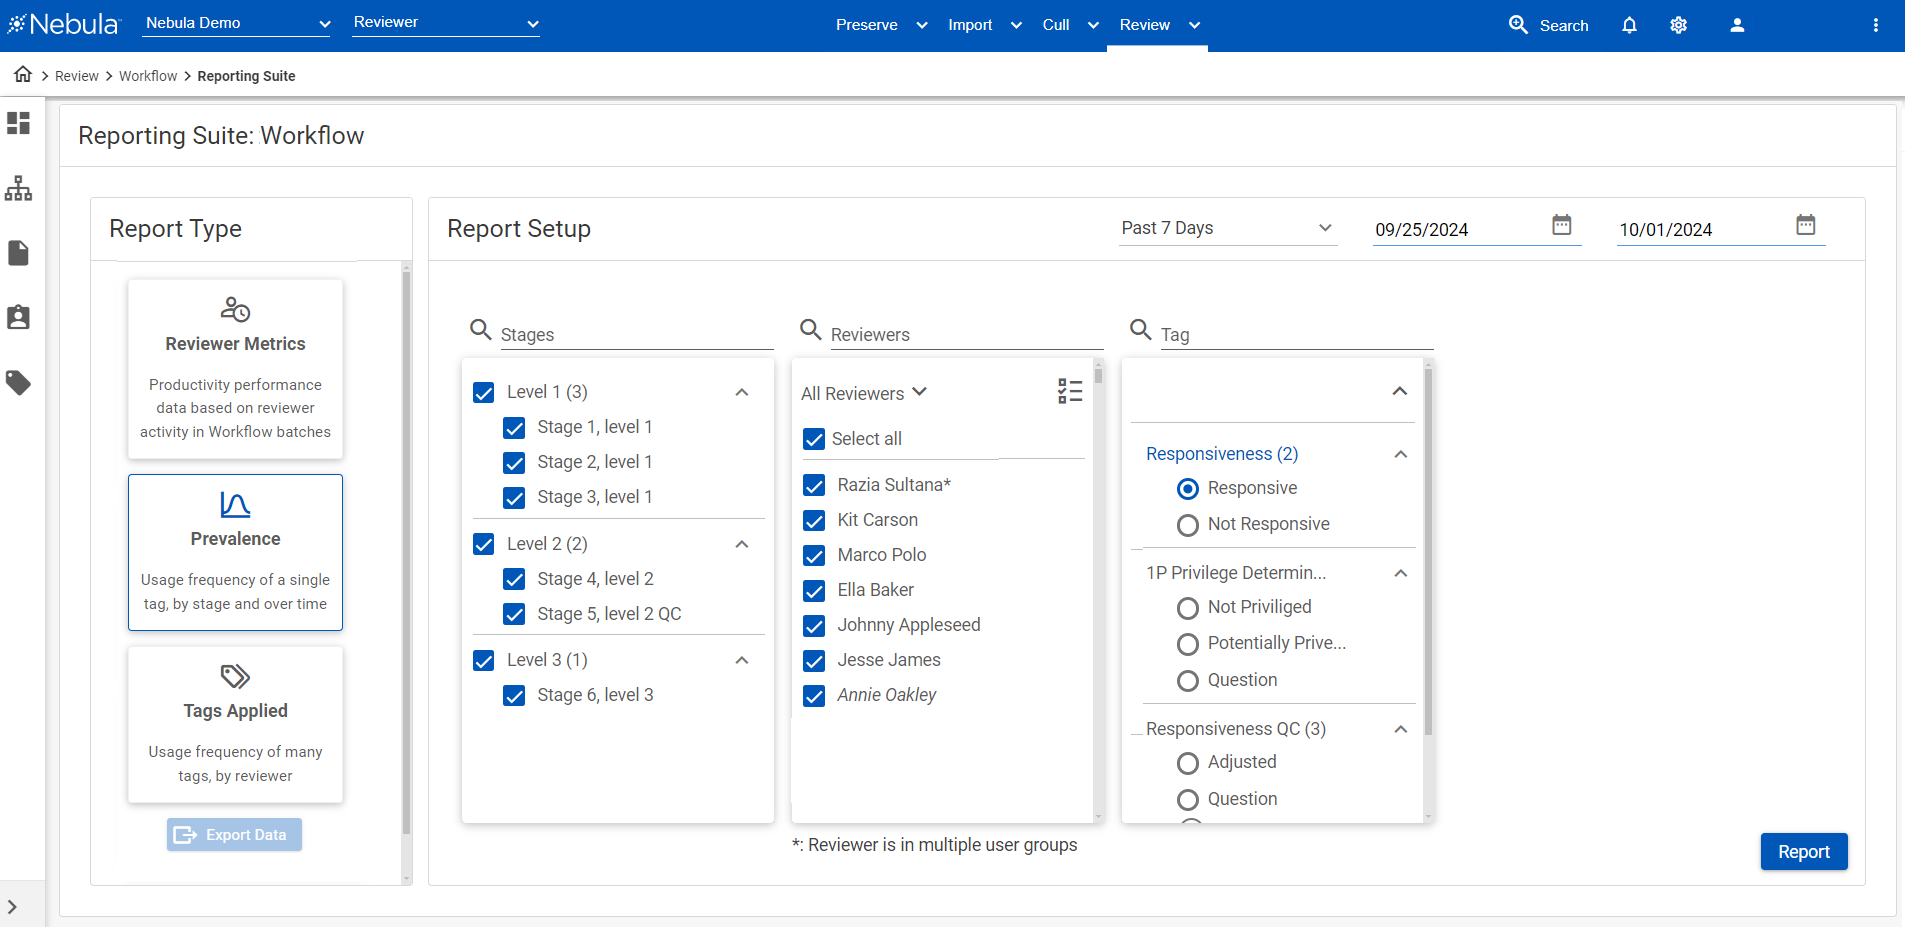
Prevalence settings
Prevalence report as a table

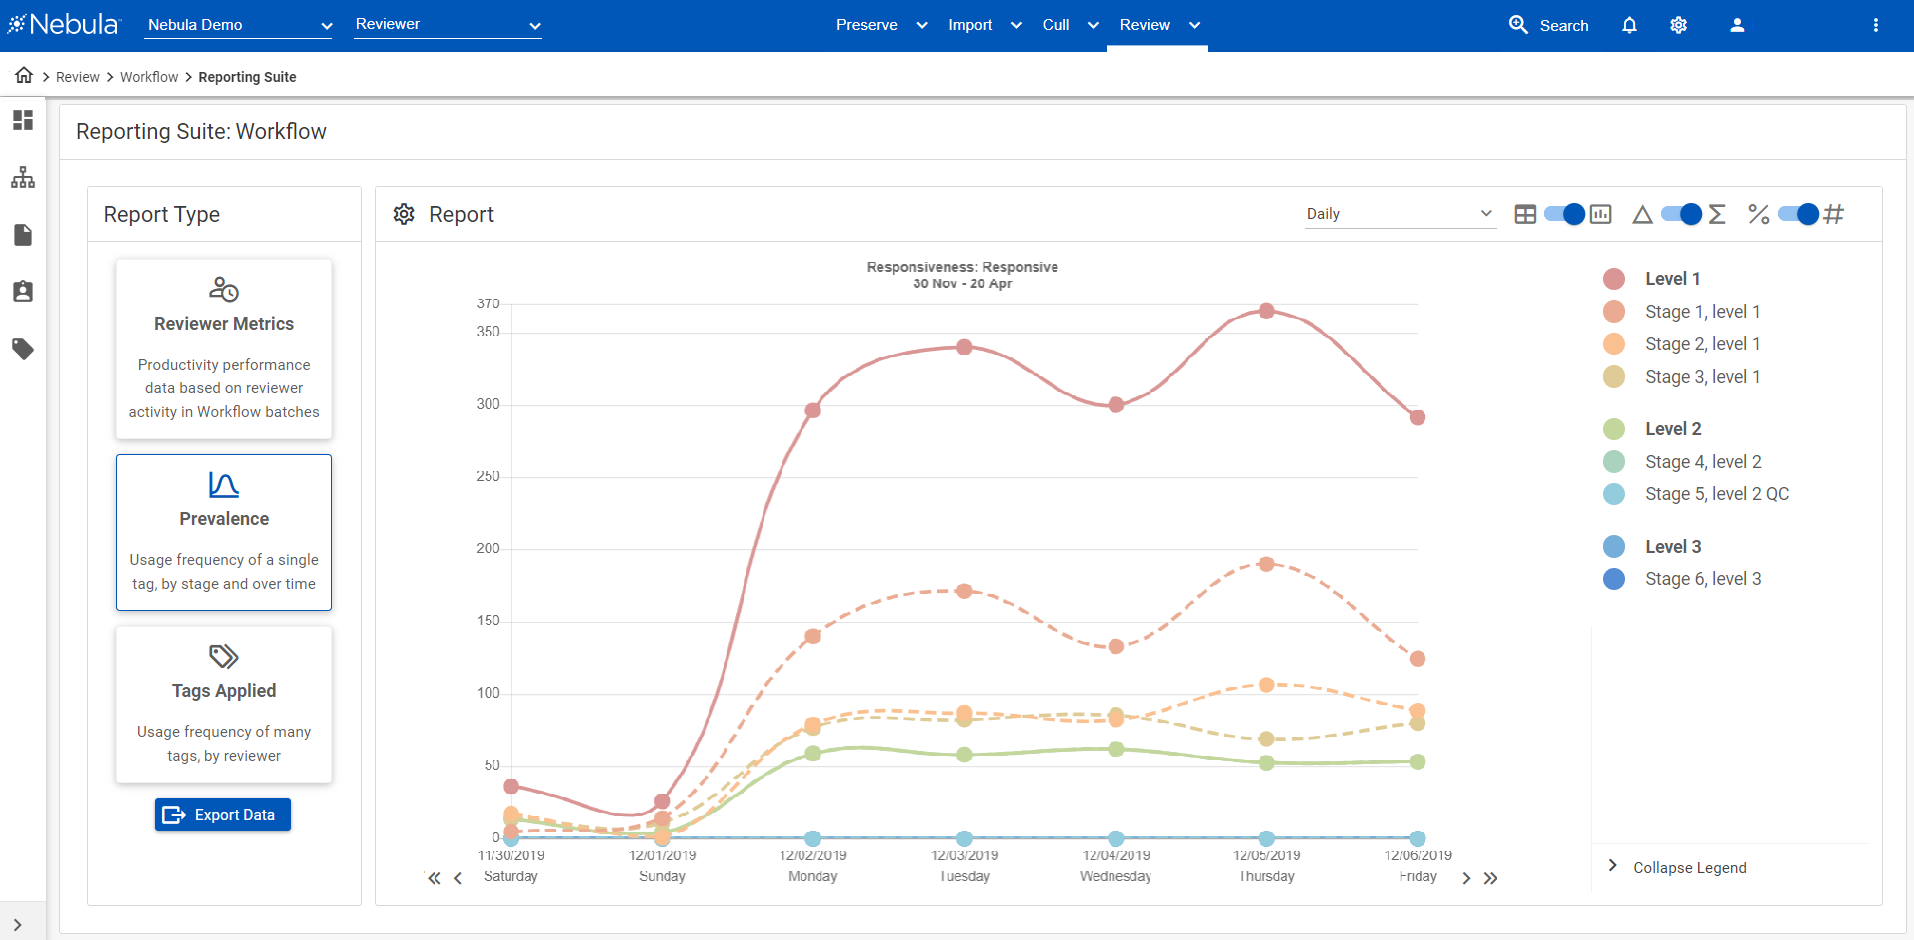
Prevalence report as graph
Prevalence Calculations
| Sum # | Sum % |
Delta # |
Delta % | |
|---|---|---|---|---|
| Chart total rows |
|
|
|
Total row main row remains the same. Sum/Delta percentage is the +/- percentage contributions toward the total count shown in the Totals row for that day/week. |
| Chart average rows | Calculated daily/hourly rates. | % of reviewers rate over calculated average. Calculated average for a day is 500 documents a day, reviewer X has 400 documents a day, percentage would be 400/500. |
Total average for a day is 500 documents a day, reviewer X has 400 documents a day, percentage would be -100. |
Total average for a day is 500 documents a day, reviewer X has 400 documents a day, percentage would be -100/500. |
| Graph values | The lines on the graph when Sum is selected are rendered from the data points noted above (Total data). | The lines on the graph when the Sum is selected are rendered from the data points noted above (Totals data). | The lines on the graphs when Delta is selected are rendered from the data points noted above (Daily rate). | The lines on the graphs when Delta is selected are rendered from the data points noted above (Daily rate). |
| Graph average | Average document count that day/week for selected group. | Average percentage contribution for that day/week for selected group. | N/A = X-axis |
N/A = X-axis |